
Mapping Azure’s Backbone with a 24-Hour iperf3 Marathon


Why I Ran This
I wanted to quantify long-haul UDP performance across a hub in Azure West US (WUS) and three peer regions—Hong Kong (HK), Korea Central (KC), and UAE North (UAE). The goal: hold a 10 Mbps stream for a full day in both directions, capture loss/jitter, and visualize the drift so colleagues can compare regional health at a glance.
Test Topology & Naming
Before testing, I provisioned one Standard_D2s_v5 VM in West US to act as the hub and receiver, plus one matching VM in each spoke region (HK, KC, UAE). Each spoke VNet is globally peered back to the West US hub VNet, so traffic stays on the Microsoft backbone without public egress. I installed iperf3 on every VM and opened UDP/5201 in each NSG so the hub and spokes could reach each other directly.
| Direction code | Description |
|---|---|
HK-WUS |
Sender in Azure East Asia → Receiver in West US |
WUS-HK |
Reverse traffic (West US → East Asia) |
KC / UAE |
Korea Central and UAE North following the same pattern |
Each completed run lands in 24H/<SOURCE>-<DEST>-10M_24H_<timestamp>.json—for example, 24H/KC-WUS-10M_24H_20251115_010046.json or 24H/WUS-HK-10M_24H_20251116_011435.json—so the prefix captures the direction at a glance.
Test Execution Scripts
1. Long-haul driver – run_iperf_24h.sh
#!/bin/bash

# iperf3 continuous test script
# Tests 10M bandwidth continuously for 24 hours

# Default server IP
DEFAULT_SERVER="172.16.0.4"

# Parse command line arguments
if [ "$1" != "" ]; then
    SERVER="$1"
else
    SERVER="$DEFAULT_SERVER"
fi

OUTPUT_DIR="./test_results"

# Create output directory if it doesn't exist
mkdir -p "$OUTPUT_DIR"

# Generate timestamp for the test
TIMESTAMP=$(date +"%Y%m%d_%H%M%S")

echo "Starting 24-hour iperf3 test..."
echo "Server: $SERVER"
echo "Bandwidth: 10M"
echo "Duration: 24 hours (86400 seconds)"
echo "Timestamp: $TIMESTAMP"
echo "========================"

# Run continuous test: 10M for 24 hours
echo "Running continuous test..."
iperf3 -c "$SERVER" -u -b 10M -i 1 -t 86400 -J > "$OUTPUT_DIR/10M_24H_${TIMESTAMP}.json"

echo ""
echo "========================"
echo "24-hour test completed!"
echo "Results saved in $OUTPUT_DIR/10M_24H_${TIMESTAMP}.json"
This script fires a single 24-hour UDP stream at 10 Mbps and writes a JSON report:
#!/bin/bash
# iperf3 continuous test script
iperf3 -c "$SERVER" -u -b 10M -i 1 -t 86400 -J > "test_results/10M_24H_${TIMESTAMP}.json"
Usage:
source .venv/bin/activate   # if you maintain a Python venv for post-processing
./run_iperf_24h.sh 172.16.0.4  # replace with your iperf3 server IP
I copied the generated JSON to region-specific folders (e.g., 24H/HK-WUS-10M_24H_20251116_011544.json) once each run completed.
Processing Pipeline – process_24h.py
Once all JSONs were in 24H/, I ran:
source .venv/bin/activate
python process_24h.py
#!/usr/bin/env python3
"""Summarize 24H iperf3 runs and generate pair diagrams."""

from __future__ import annotations

import json
from dataclasses import dataclass
from datetime import datetime, timezone
from pathlib import Path
from typing import Dict, List, Tuple

import matplotlib.pyplot as plt
import matplotlib.ticker as mticker
import numpy as np

DATA_DIR = Path("24H")
OUTPUT_DIR = Path("diagrams/24h")
OUTPUT_DIR.mkdir(parents=True, exist_ok=True)

WUS_INBOUND_COLOR = "#2ca02c"
WUS_OUTBOUND_COLOR = "#1f77b4"


@dataclass
class DirectionResult:
    """Holds derived metrics for a single iperf direction."""

    file_name: str
    source: str
    destination: str
    label: str
    start_time: str
    duration_hours: float
    mean_mbps: float
    median_mbps: float
    min_mbps: float
    max_mbps: float
    std_mbps: float
    mean_pkt_rate: float
    jitter_ms: float
    lost_packets: int
    total_packets: int
    loss_percent: float
    reported_mbps: float
    times_hours: np.ndarray
    bandwidth_series: np.ndarray


def parse_intervals(raw_intervals: List[Dict]) -> Tuple[np.ndarray, np.ndarray, np.ndarray]:
    """Convert interval dicts into numpy arrays for plotting/statistics."""

    ends = []
    bandwidth = []
    packet_rate = []
    for interval in raw_intervals:
        summary = interval.get("sum") or interval["streams"][0]
        seconds = summary["seconds"] or 1.0
        ends.append(summary["end"] / 3600.0)
        bandwidth.append(summary["bits_per_second"] / 1_000_000.0)
        packet_rate.append(summary["packets"] / seconds)
    return np.asarray(ends), np.asarray(bandwidth), np.asarray(packet_rate)


def load_direction(path: Path) -> DirectionResult:
    with path.open("r", encoding="utf-8") as handle:
        payload = json.load(handle)

    intervals = payload["intervals"]
    times_h, bandwidth_mbps, pkt_rate = parse_intervals(intervals)

    end_sum = payload.get("end", {}).get("sum", {})
    start_epoch = payload["start"]["timestamp"]["timesecs"]
    start_time = datetime.fromtimestamp(start_epoch, tz=timezone.utc).strftime("%Y-%m-%d %H:%M:%SZ")

    parts = path.stem.split("-")
    source = parts[0]
    destination = parts[1] if len(parts) > 1 else "UNKNOWN"

    duration_hours = (end_sum.get("seconds") or payload["start"]["test_start"].get("duration", 0)) / 3600.0
    lost_packets = int(end_sum.get("lost_packets", 0))
    total_packets = int(end_sum.get("packets", 0))
    loss_percent = float(end_sum.get("lost_percent", 0.0) or 0.0)
    jitter_ms = float(end_sum.get("jitter_ms", 0.0))
    reported_mbps = (end_sum.get("bits_per_second", 0.0) or 0.0) / 1_000_000.0

    return DirectionResult(
        file_name=path.name,
        source=source,
        destination=destination,
        label=f"{source}->{destination}",
        start_time=start_time,
        duration_hours=duration_hours,
        mean_mbps=float(np.mean(bandwidth_mbps)),
        median_mbps=float(np.median(bandwidth_mbps)),
        min_mbps=float(np.min(bandwidth_mbps)),
        max_mbps=float(np.max(bandwidth_mbps)),
        std_mbps=float(np.std(bandwidth_mbps)),
        mean_pkt_rate=float(np.mean(pkt_rate)),
        jitter_ms=jitter_ms,
        lost_packets=lost_packets,
        total_packets=total_packets,
        loss_percent=loss_percent,
        reported_mbps=reported_mbps,
        times_hours=times_h,
        bandwidth_series=bandwidth_mbps,
    )


def group_by_pair(results: List[DirectionResult]) -> Dict[Tuple[str, str], List[DirectionResult]]:
    pairs: Dict[Tuple[str, str], List[DirectionResult]] = {}
    for result in results:
        key = tuple(sorted([result.source, result.destination]))
        pairs.setdefault(key, []).append(result)
    return pairs


def _pair_line_color(entry: DirectionResult) -> str:
    return WUS_INBOUND_COLOR if entry.destination.upper() == "WUS" else WUS_OUTBOUND_COLOR


def _apply_zoomed_ylim(ax: plt.Axes, entries: List[DirectionResult]) -> None:
    all_values = np.concatenate([entry.bandwidth_series for entry in entries])
    min_val = float(all_values.min())
    max_val = float(all_values.max())
    if np.isclose(min_val, max_val):
        center = min_val
        padding = max(0.005, center * 0.0005)
        ax.set_ylim(center - padding, center + padding)
    else:
        padding = max(0.002, (max_val - min_val) * 0.2)
        ax.set_ylim(min_val - padding, max_val + padding)
    ax.yaxis.set_major_locator(mticker.MaxNLocator(6))


def save_pair_plots(pairs: Dict[Tuple[str, str], List[DirectionResult]]) -> None:
    plt.style.use("seaborn-v0_8")
    for (loc_a, loc_b), entries in pairs.items():
        sorted_entries = sorted(
            entries,
            key=lambda r: (0 if r.destination.upper() == "WUS" else 1, r.label),
        )

        fig, axes = plt.subplots(len(sorted_entries), 1, figsize=(14, 8), sharex=True)
        if len(sorted_entries) == 1:
            axes = [axes]

        for ax, entry in zip(axes, sorted_entries):
            ax.plot(
                entry.times_hours,
                entry.bandwidth_series,
                linewidth=1.2,
                color=_pair_line_color(entry),
            )
            ax.fill_between(
                entry.times_hours,
                entry.bandwidth_series,
                color=_pair_line_color(entry),
                alpha=0.15,
            )
            ax.set_ylabel("Bandwidth (Mbps)")
            ax.set_xlim(0, 24)
            _apply_zoomed_ylim(ax, [entry])
            ax.grid(alpha=0.3)
            ax.set_title(
                f"{entry.label} • loss {entry.loss_percent:.6f}% • jitter {entry.jitter_ms:.4f} ms",
                fontsize=11,
            )

        axes[-1].set_xlabel("Time (hours)")
        fig.suptitle(f"UDP Bandwidth Over Time: {loc_a} <-> {loc_b}", fontsize=14)
        fig.tight_layout(rect=(0, 0, 1, 0.97))
        output_path = OUTPUT_DIR / f"pair_{loc_a}_{loc_b}_bandwidth.png"
        fig.savefig(output_path, dpi=200)
        plt.close(fig)
        print(f"Saved diagram: {output_path}")


def save_direction_plots(pairs: Dict[Tuple[str, str], List[DirectionResult]]) -> None:
    plt.style.use("seaborn-v0_8")
    for entries in pairs.values():
        for entry in entries:
            fig, ax = plt.subplots(figsize=(12, 5))
            ax.plot(entry.times_hours, entry.bandwidth_series, linewidth=1.4)
            ax.set_title(f"UDP Bandwidth Over Time: {entry.label}")
            ax.set_xlabel("Time (hours)")
            ax.set_ylabel("Bandwidth (Mbps)")
            ax.set_xlim(0, 24)
            ax.grid(alpha=0.3)
            output_path = OUTPUT_DIR / f"direction_{entry.source}_{entry.destination}_bandwidth.png"
            fig.tight_layout()
            fig.savefig(output_path, dpi=200)
            plt.close(fig)
            print(f"Saved diagram: {output_path}")


def write_summary(results: List[DirectionResult], pairs: Dict[Tuple[str, str], List[DirectionResult]]) -> None:
    lines: List[str] = []
    lines.append("# 24H iperf3 Summary\n")
    lines.append("Generated on: %s\n\n" % datetime.now(tz=timezone.utc).strftime("%Y-%m-%d %H:%M:%SZ"))

    header = "| Direction | Mean Mbps | Std Mbps | Min Mbps | Max Mbps | Loss % | Lost/Total pkts | Jitter (ms) |"
    divider = "|---|---:|---:|---:|---:|---:|---:|---:|"
    lines.append(header)
    lines.append(divider)
    for result in sorted(results, key=lambda r: r.label):
        lines.append(
            "| {label} | {mean:.4f} | {std:.4f} | {minv:.4f} | {maxv:.4f} | {loss:.6f} | {lost}/{total} | {jitter:.4f} |".format(
                label=result.label,
                mean=result.mean_mbps,
                std=result.std_mbps,
                minv=result.min_mbps,
                maxv=result.max_mbps,
                loss=result.loss_percent,
                lost=result.lost_packets,
                total=result.total_packets,
                jitter=result.jitter_ms,
            )
        )

    lines.append("\n## Pair observations\n")
    for (loc_a, loc_b), entries in sorted(pairs.items()):
        lines.append(f"### {loc_a} <-> {loc_b}\n")
        for entry in sorted(entries, key=lambda r: r.label):
            lines.append(
                "- {label}: mean {mean:.4f} Mbps, jitter {jitter:.4f} ms, loss {loss:.6f}% ({lost} packets)".format(
                    label=entry.label,
                    mean=entry.mean_mbps,
                    jitter=entry.jitter_ms,
                    loss=entry.loss_percent,
                    lost=entry.lost_packets,
                )
            )
        if len(entries) == 2:
            delta = abs(entries[0].mean_mbps - entries[1].mean_mbps)
            faster = max(entries, key=lambda r: r.mean_mbps)
            lines.append(f"- Directional delta: {delta:.6f} Mbps (higher on {faster.label})")
        lines.append("")

    output_path = OUTPUT_DIR / "summary_report.md"
    output_path.write_text("\n".join(lines), encoding="utf-8")
    print(f"Saved summary: {output_path}")


def main() -> None:
    if not DATA_DIR.exists():
        raise SystemExit(f"Data directory '{DATA_DIR}' not found")

    json_files = sorted(DATA_DIR.glob("*.json"))
    if not json_files:
        raise SystemExit("No JSON files found in 24H directory")

    results = [load_direction(path) for path in json_files]
    pairs = group_by_pair(results)

    save_pair_plots(pairs)
    save_direction_plots(pairs)
    write_summary(results, pairs)

    for result in results:
        print(
            "{label}: mean {mean:.4f} Mbps, loss {loss:.6f}%, jitter {jitter:.4f} ms".format(
                label=result.label,
                mean=result.mean_mbps,
                loss=result.loss_percent,
                jitter=result.jitter_ms,
            )
        )


if __name__ == "__main__":
    main()
The script does the heavy lifting:
- Parse every JSON file, capturing per-second intervals and the iperf “end” summary.
- Compute statistics (mean, min, max, std, packet loss, jitter).
- Render plots:
- Pair diagrams: stacked subplots for each direction in a region pair, color-coded (green ➜ inbound to WUS, blue ➜ outbound).
- Single-direction charts: detailed time series with a zoomed y-axis around 10 Mbps.
- Publish a Markdown report at
diagrams/24h/summary_report.md.
Key Results (10 Mbps UDP, 24 Hours)
| Direction | Mean Mbps | Std Mbps | Min Mbps | Max Mbps | Loss % | Lost/Total pkts | Jitter (ms) |
|---|---|---|---|---|---|---|---|
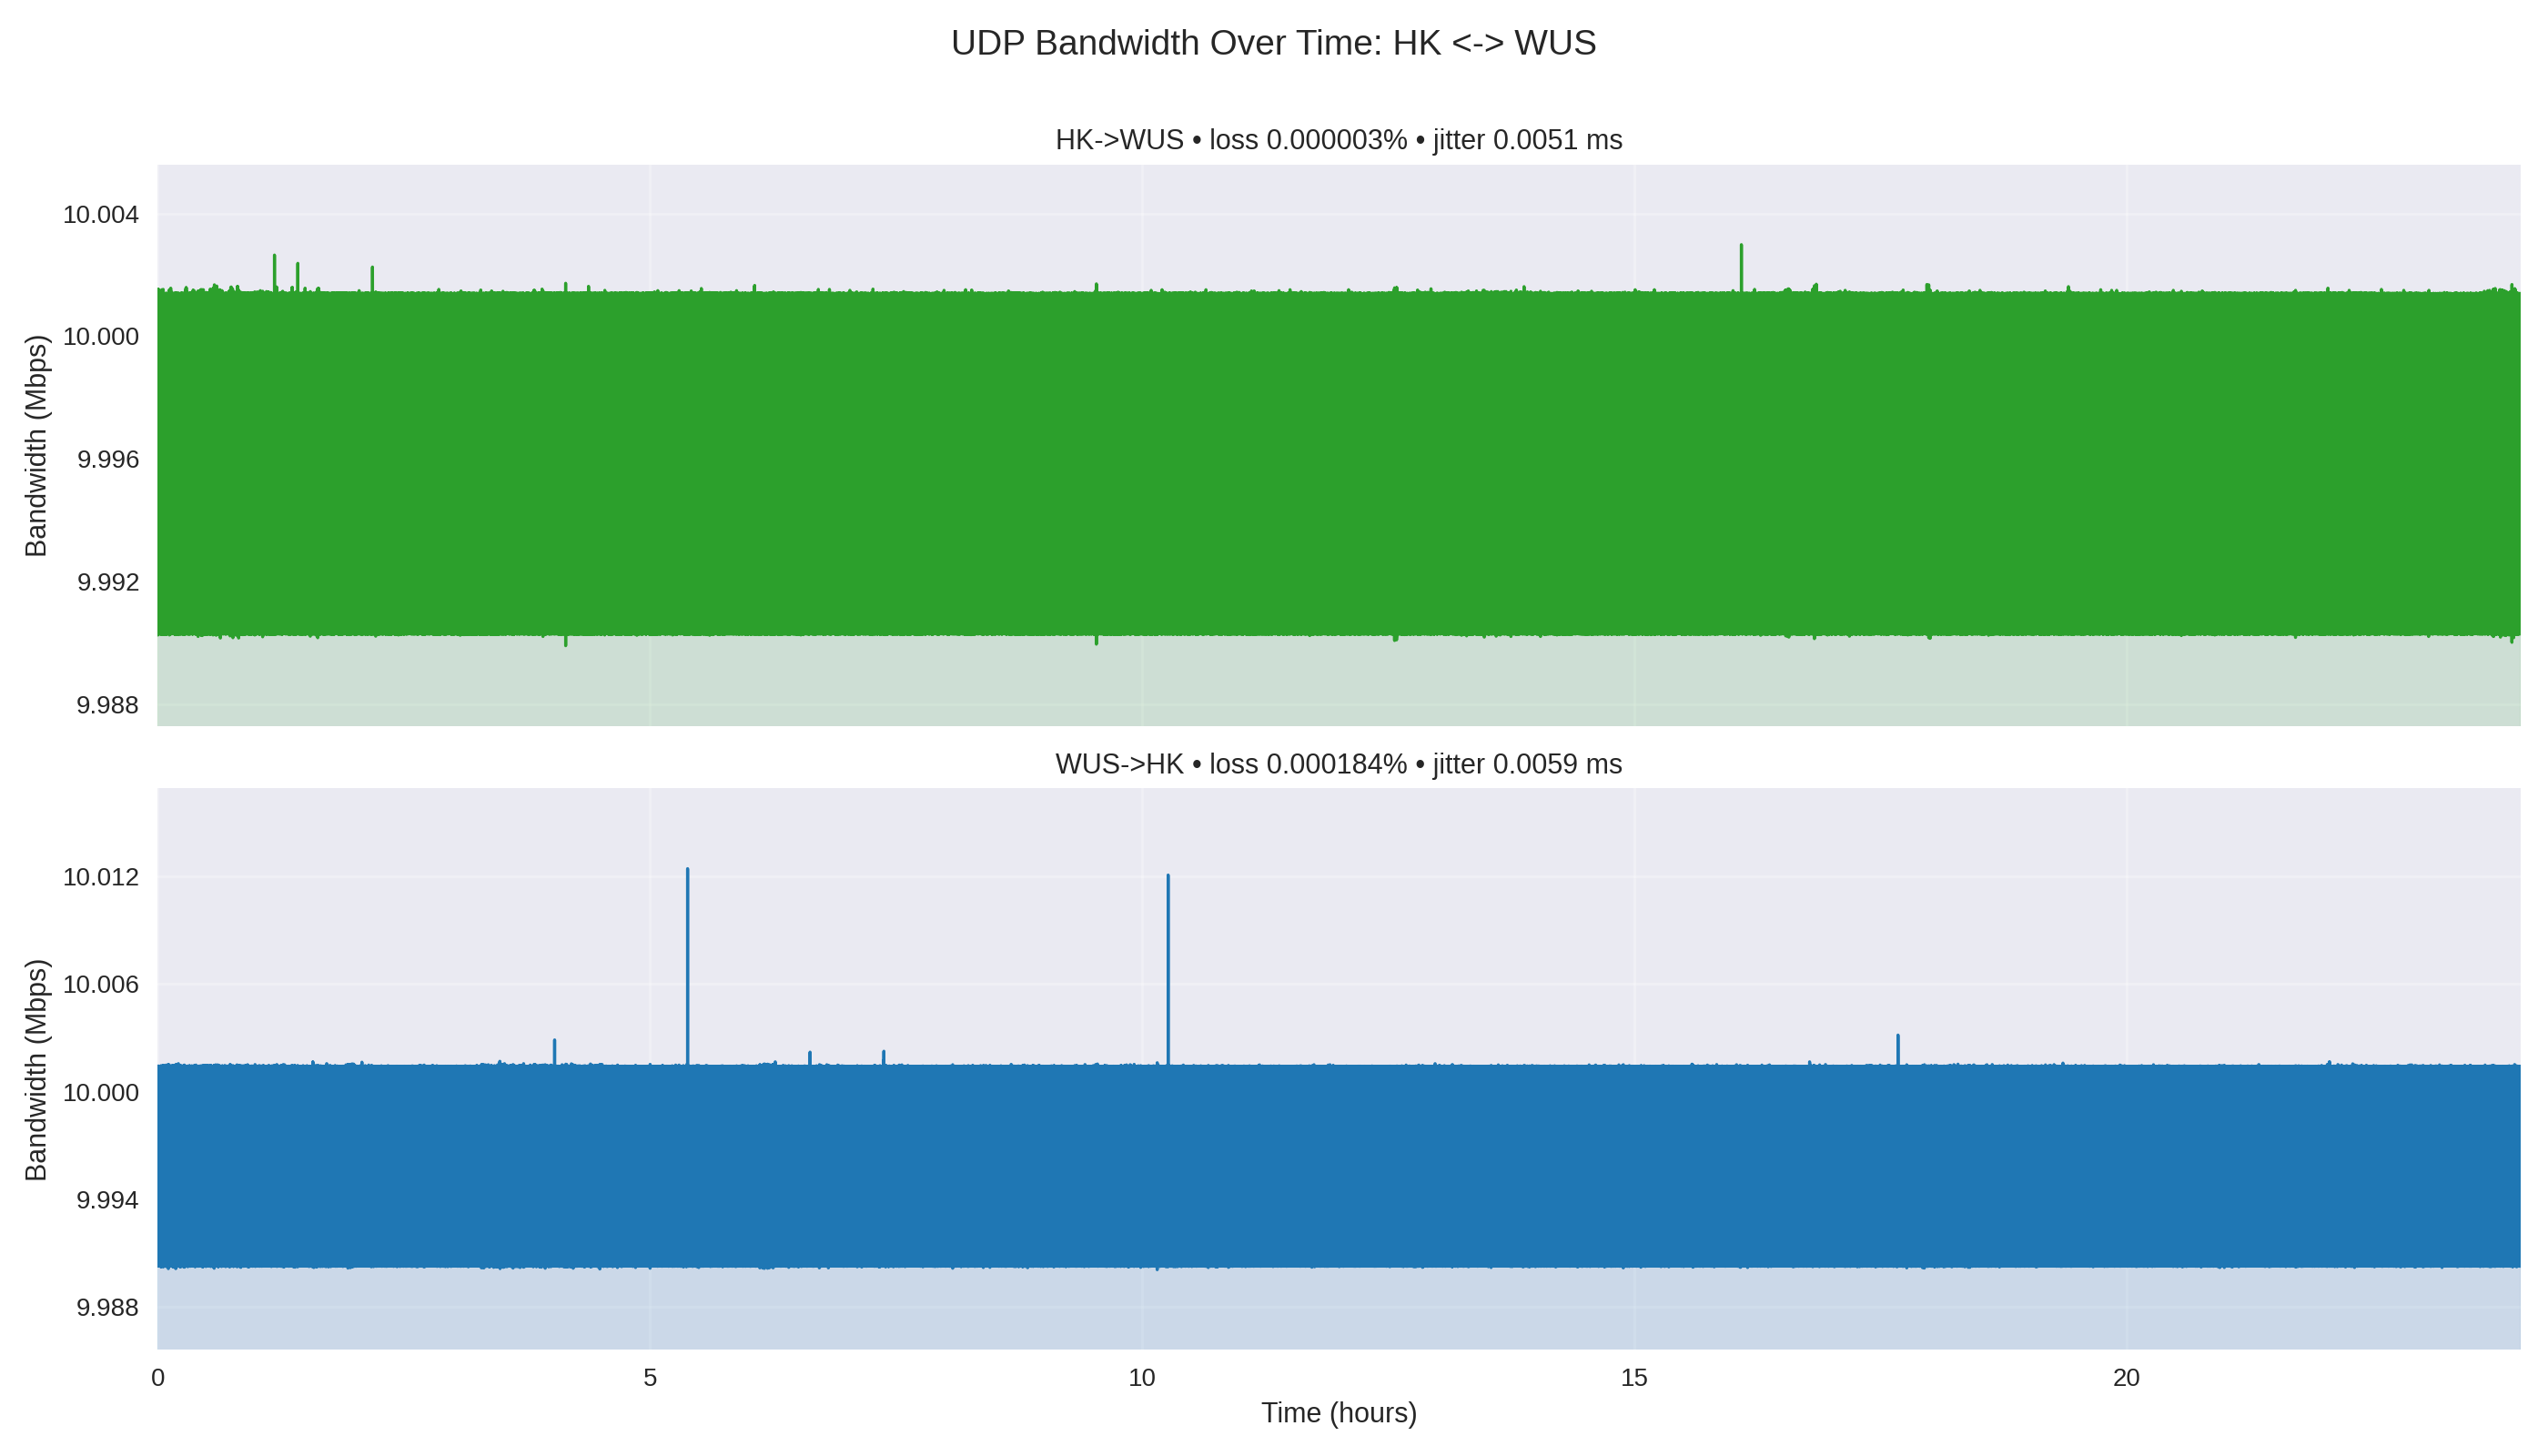
| HK→WUS | 10.0000 | 0.0037 | 9.9899 | 10.0030 | 0.000003 | 2 / 77,922,078 | 0.0051 |
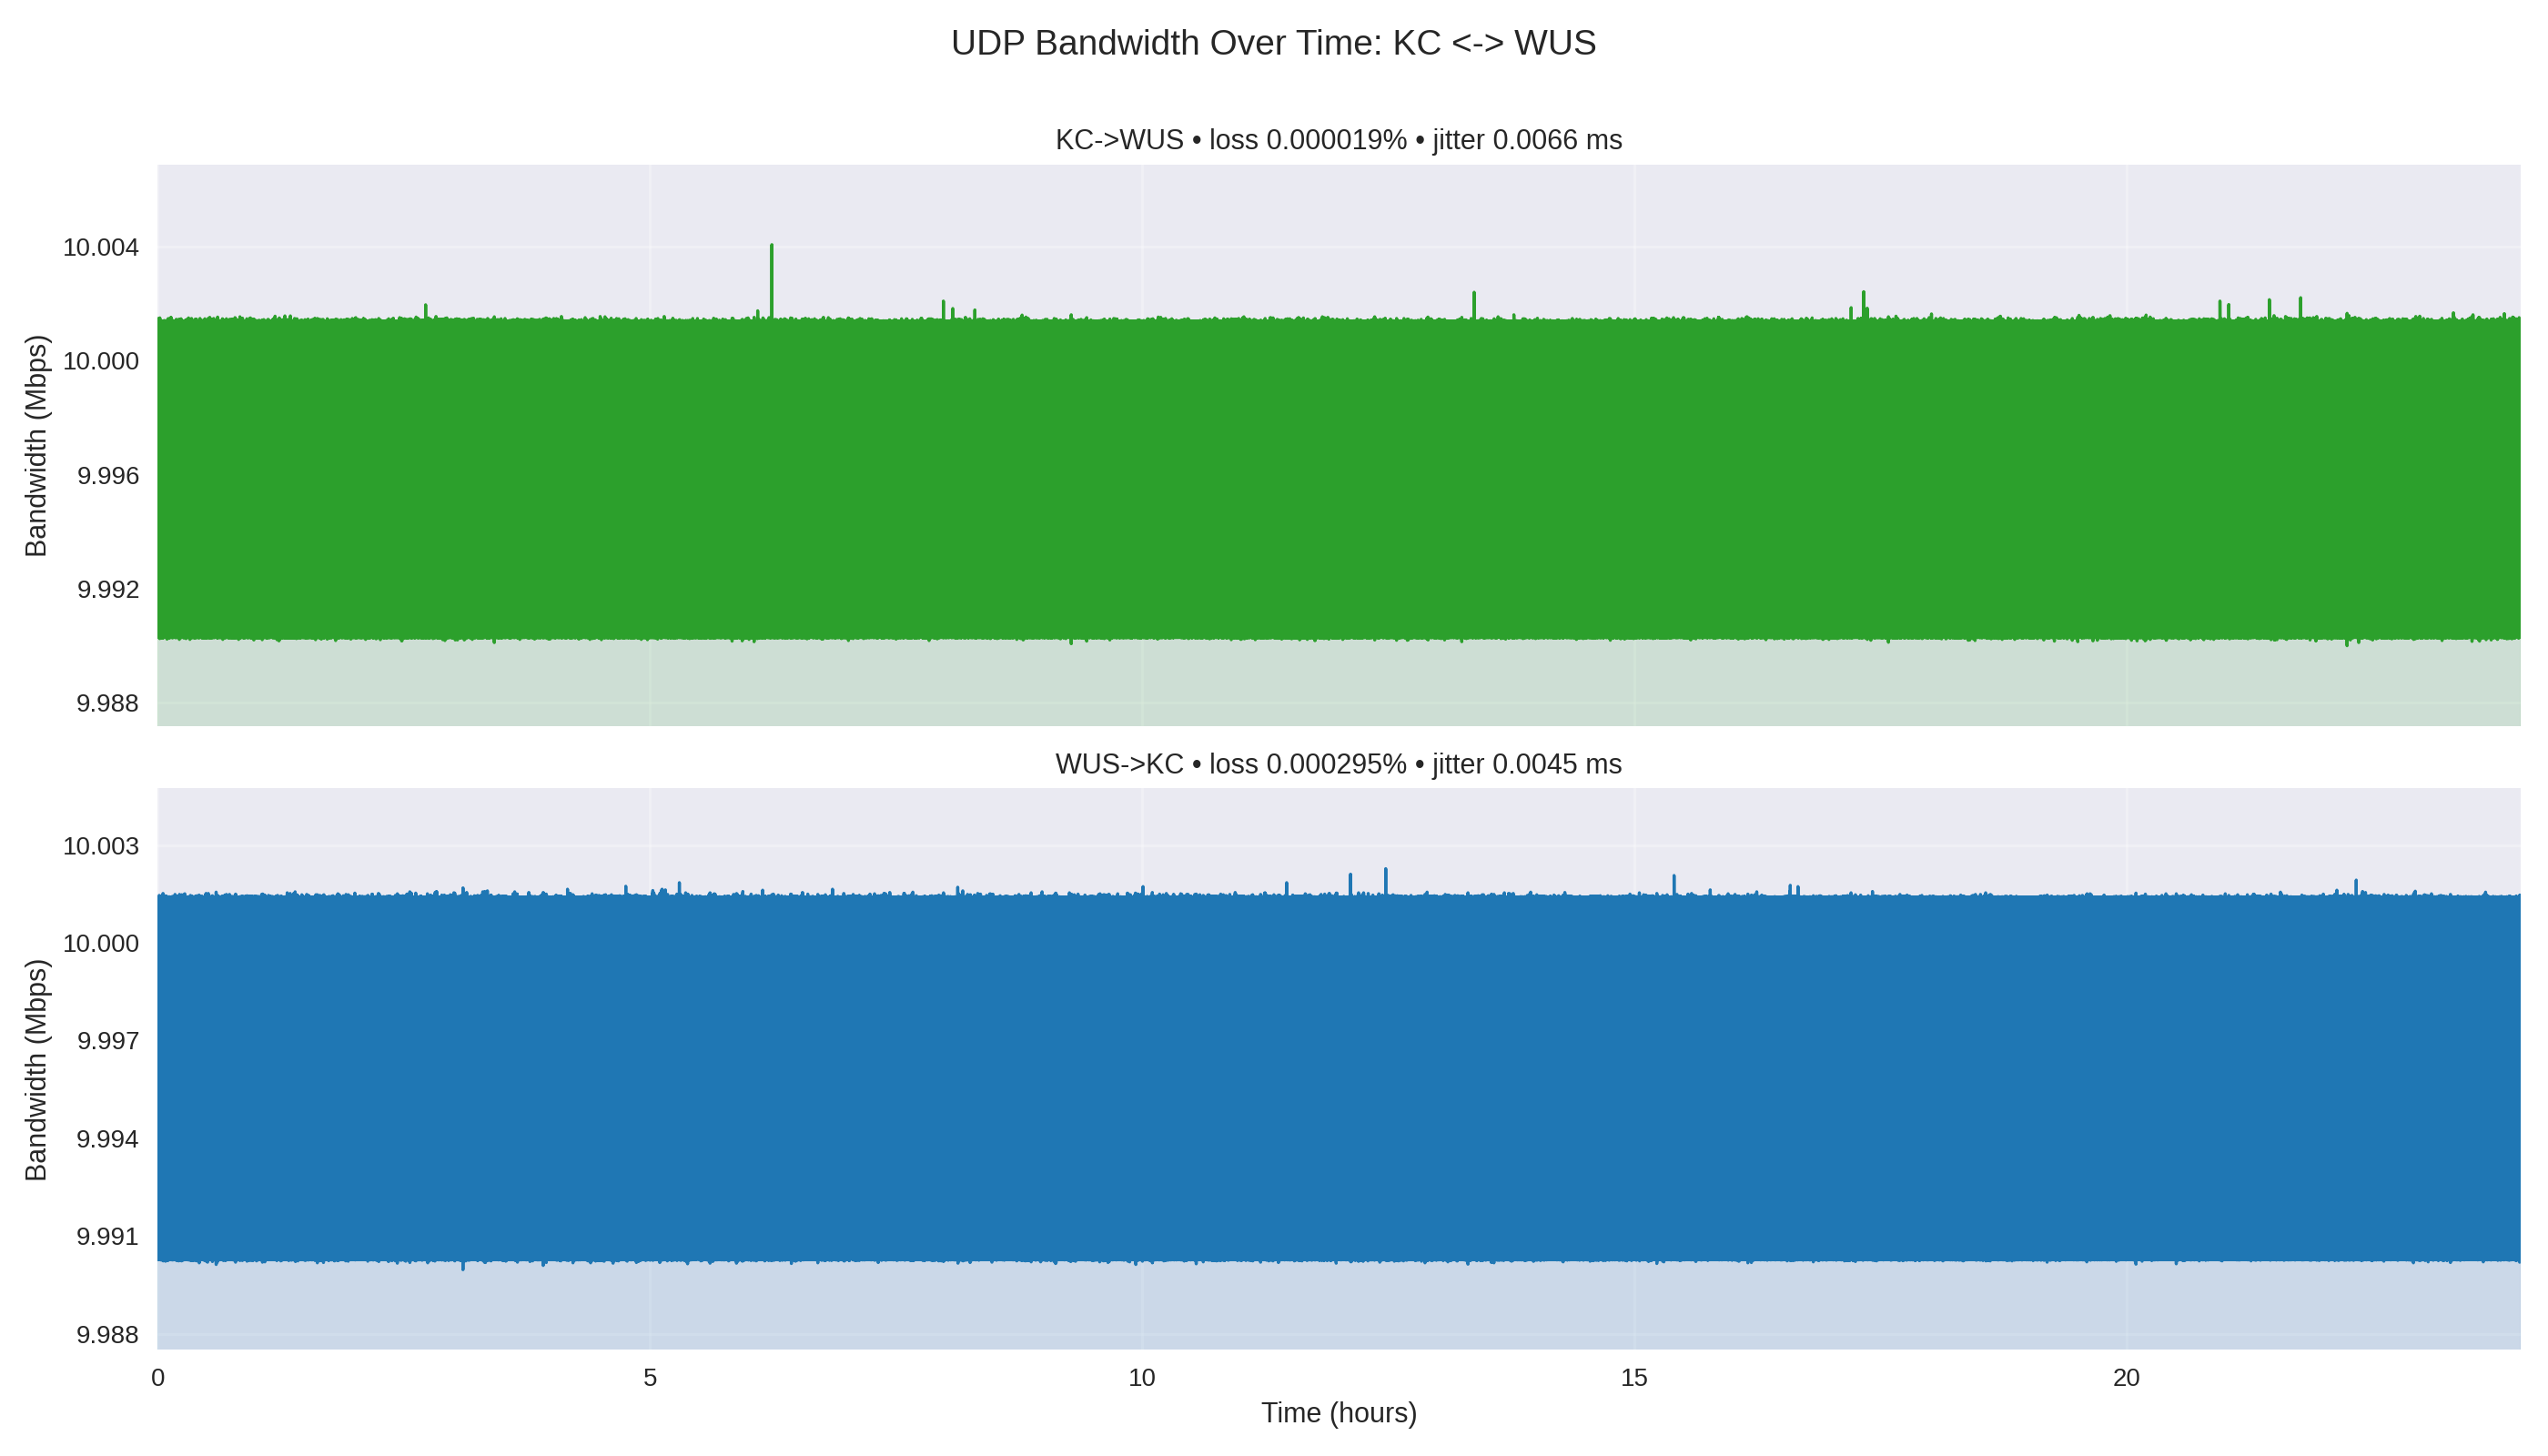
| KC→WUS | 10.0000 | 0.0037 | 9.9900 | 10.0041 | 0.000019 | 15 / 77,922,078 | 0.0066 |
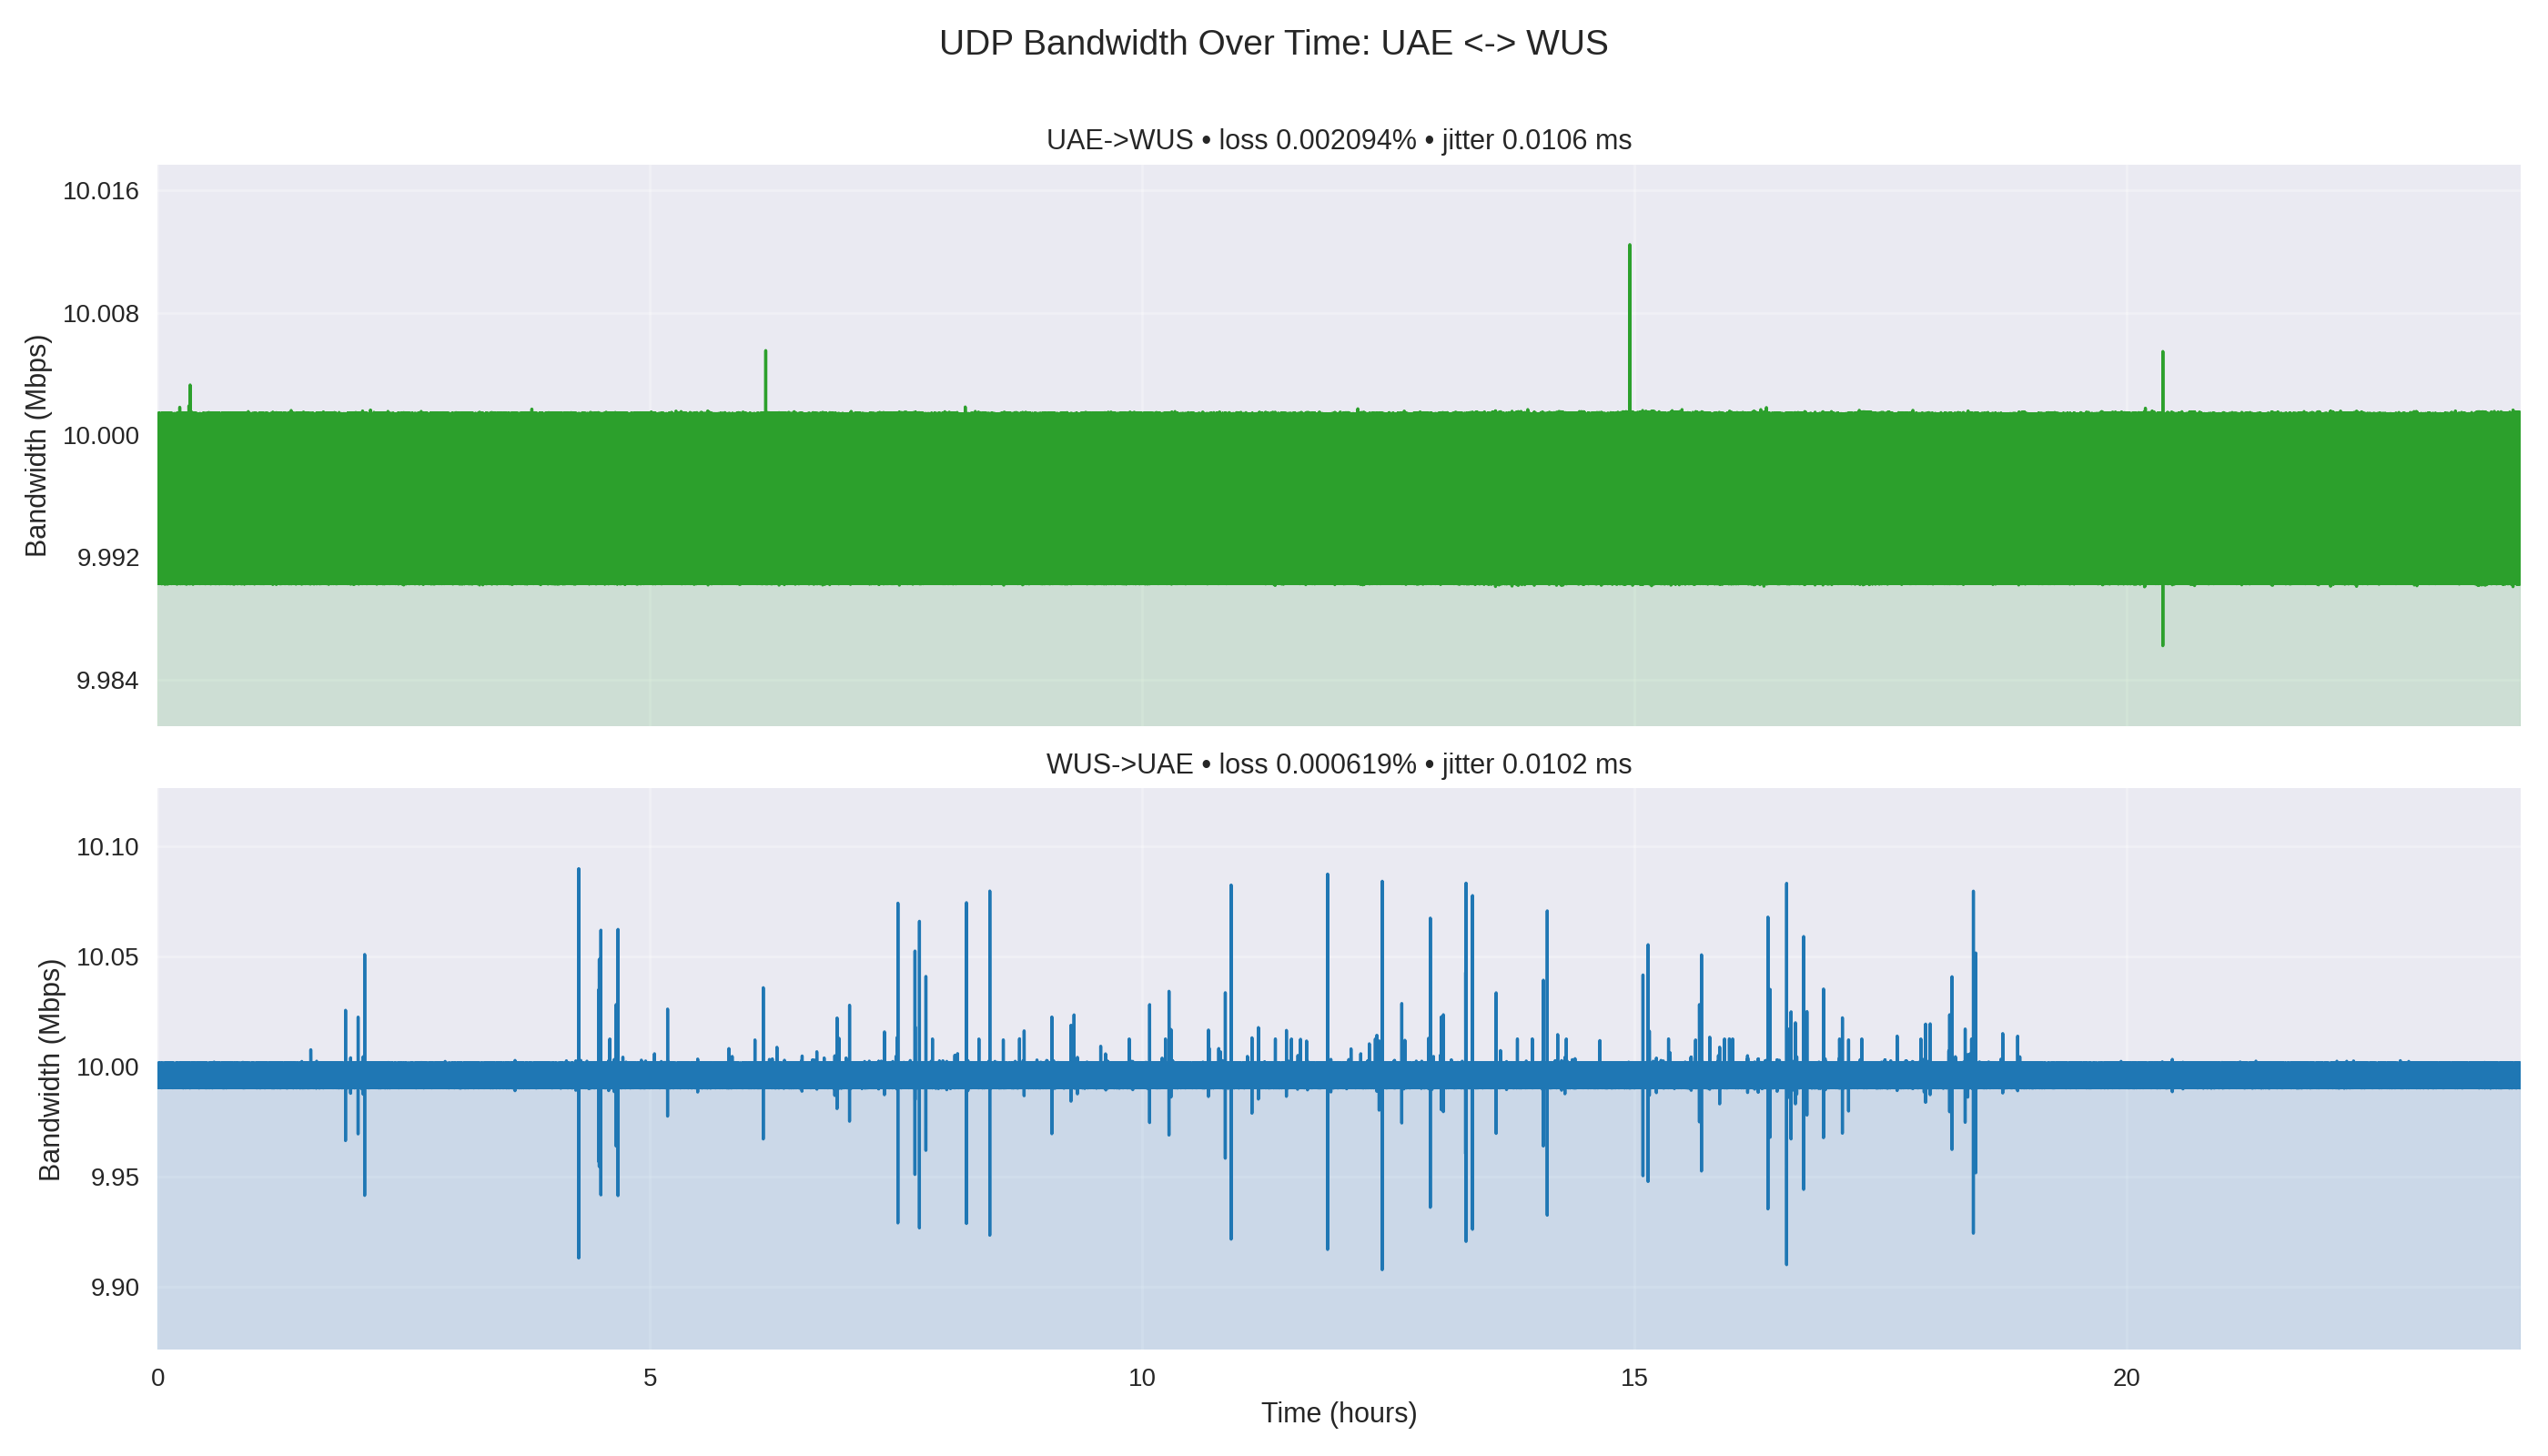
| UAE→WUS | 10.0000 | 0.0037 | 9.9862 | 10.0125 | 0.002094 | 1,632 / 77,922,078 | 0.0106 |
| WUS→HK | 10.0000 | 0.0037 | 9.9901 | 10.0124 | 0.000184 | 143 / 77,922,078 | 0.0059 |
| WUS→KC | 10.0000 | 0.0037 | 9.9900 | 10.0023 | 0.000295 | 230 / 77,922,078 | 0.0045 |
| WUS→UAE | 10.0000 | 0.0041 | 9.9077 | 10.0897 | 0.000619 | 482 / 77,922,078 | 0.0102 |
Takeaways
- 📬 Deliverability: Every flow held the target 10 Mbps for the full day; deviations stayed within ±0.1%.
- 🧵 Loss Concentration: The UAE legs exhibited 0.002–0.0006% loss (still tiny, yet two orders of magnitude higher than HK/KC), indicating a good focus area for route tuning.
- ⚖️ Symmetry: HK↔WUS and KC↔WUS remained closely matched; the outbound deltas hovered near zero.
Reproducing the Workflow
-
Provision iperf3 endpoints (UDP mode, port 5201) in each Azure region.
-
Run each direction of
run_iperf_24h.sh, supplying the peer IP. The script logs JSON data at 1-second intervals for 86,400 seconds. -
Collect JSON reports into a folder named for the direction (I used
24H/). -
Install dependencies (Python 3.11+,
matplotlib,numpy) within a venv:python3 -m venv .venv source .venv/bin/activate python -m pip install matplotlib numpy -
Generate diagrams & reports:
python process_24h.py -
Publish the
summary_report.mdand PNGs to your blog or dashboard.
Lessons Learned
- Lightweight UDP tests (10 Mbps) reveal nuances in packet handling over time—you see jitter bursts and sporadic loss spikes that short tests miss.
- Automating the analysis in
process_24h.pypays off: running it again after new data is a single command, and the visuals stay consistent. - Separating pair plots into stacked panels avoids trace overlap, making direction-specific blips obvious—a tiny tweak that boosts readability for stakeholders.
Final Thoughts
This setup gives me a repeatable, midnight-safe way to benchmark inter-region reliability, enrich status reviews, and catch regressions quickly. If you copy the repo, drop in your own JSON captures, and run the analyzer, you’ll get the same report layouts ready to embed in a blog or slide deck.
Let me know if you want a companion dashboard or a GitHub Action to run the post-processing automatically—happy to help!